XRP Price Analysis: Bulls Target $2.20 Amid Volatile Trading

April 1, 2025 – XRP is facing a consolidation phase in a downtrend, as the price fluctuates between $2.12 – $2.135, with a 24-hour trading range of $2.07 – $2.19. The market cap currently stands at $123 billion, while the trading volume is $4.18 billion, reflecting cautious investor sentiment.
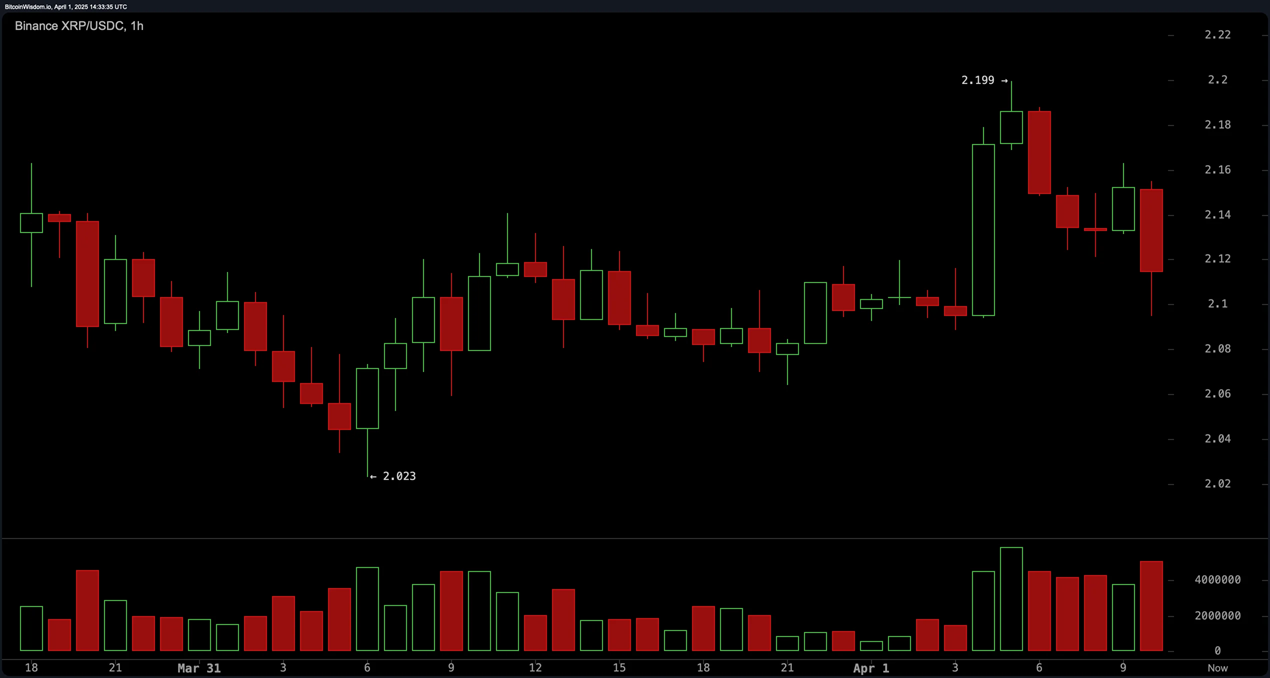
1-Hour Chart: Volatile Price Action and Bearish Pressure
On the 1-hour chart, XRP is under short-term selling pressure, with the recent high of $2.199 indicating a strong price rejection. The $2.10 support zone has been tested multiple times, indicating resilience but also potential downside risk.
If the price breaks below $2.10, XRP could drop to $2.02, creating a selling opportunity for short-term traders. However, if it holds above $2.10, a recovery to $2.18 – $2.20 is still possible, but the current bullish momentum is quite weak.
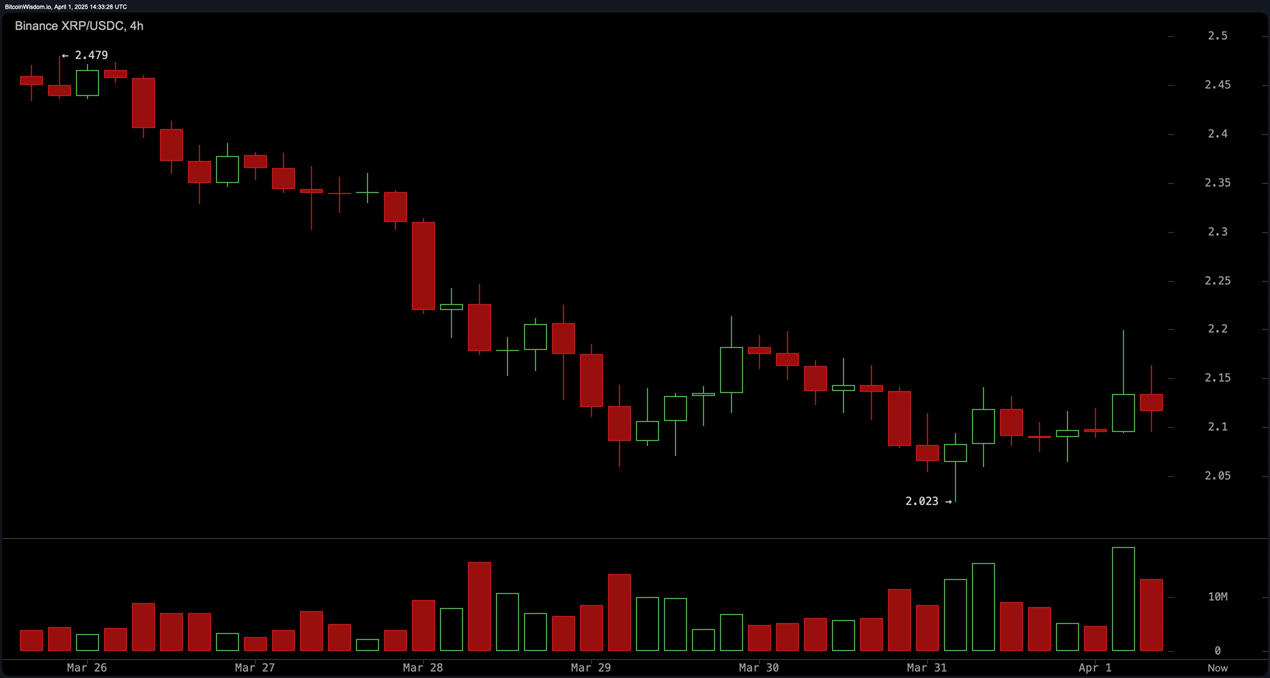
4-hour chart: Accumulation pattern with breakout potential
XRP is in a consolidation phase after a downtrend, with key support near $2.02, while resistance lies at $2.15 – $2.20.
The strong trading volume at the resistance zone suggests a potential bull trap, as sellers may distribute supply. If the price closes above $2.20 on high volume, a recovery towards $2.40 is possible. However, if XRP fails to stay above $2.10, selling pressure could push the price below $2.00.
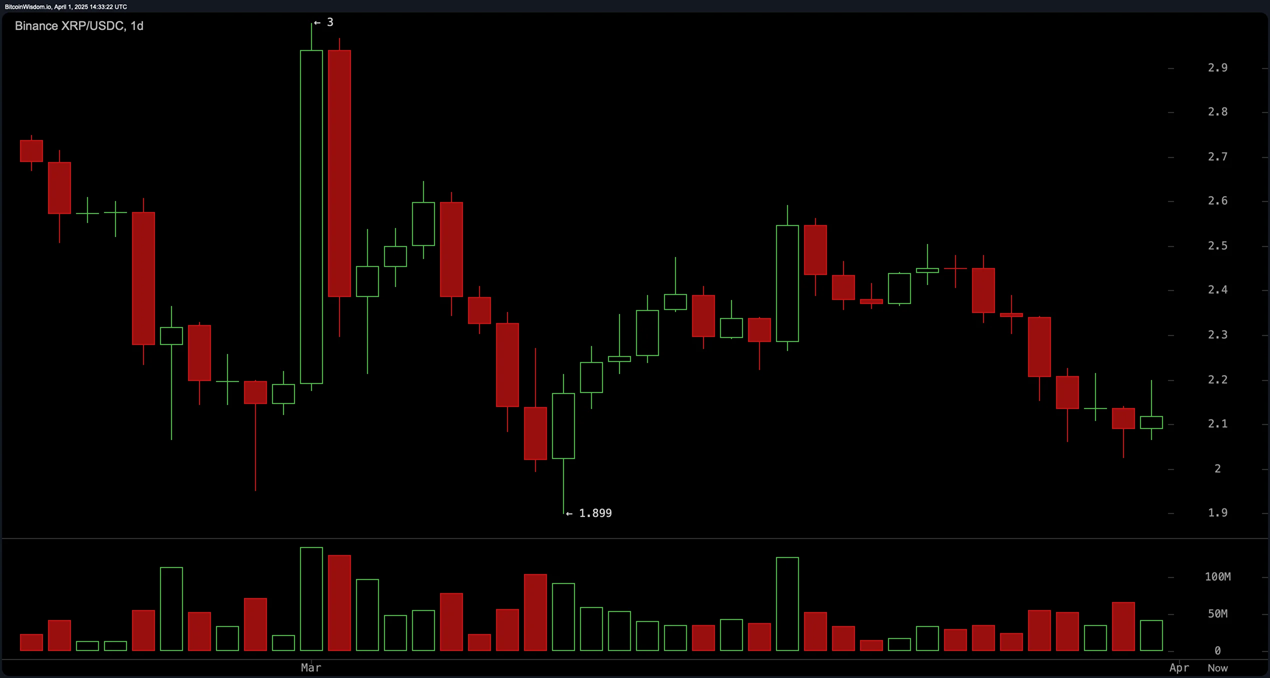
Daily Chart: Short-term Downtrend and Strong Support
After peaking at $2.90, XRP continues its short-term downtrend, with successive lower highs. The key support zone of $1.90 – $2.00 is holding, while strong resistance is at $2.50 – $2.60.
The trading volume increased sharply in the previous sessions, but was later absorbed by selling pressure, suggesting that the previous rally may have been a false top. If the price drops to $2.00 – $2.10 and a reversal candlestick pattern appears, this could be a potential buying opportunity.
Technical indicators: Mixed outlook with downside risk
The oscillators on the daily chart provide mixed signals:
- RSI at 39.94, neutral, not yet in oversold territory.
- Stochastic at 14.29, near oversold, buying pressure may return.
- CCI at -135.11, indicating XRP is undervalued, with a potential upside reversal.
- Momentum at -0.25, indicating the downtrend is still dominant.
- MACD at -0.06858, confirming the prevailing bearish signal.
- ADX neutral, reflecting the lack of clear direction of the current trend.
Moving Averages: Short-term downtrend but positive long-term outlook
- EMA 10 ($2,221) and SMA 10 ($2,270): Above the current price, reflecting short-term selling pressure.
- EMA 200 ($1,943) and SMA 200 ($1,802): Still maintaining the long-term uptrend, but need to hold important support.
The divergence between the short-term and long-term moving averages suggests that XRP is in a correction, with key support levels playing a role in determining the upcoming direction.
Forecast and Trading Strategy
Bull Verdict:
- If XRP holds above $2.10 and breaks $2.20 on strong volume, the price could head towards $2.40.
- CCI and momentum indicators are favoring upside if there is fresh momentum.
Bear Verdict:
The main trend remains bearish, with many technical indicators tilted to the downside.
- If XRP breaks below $2.10, the risk of a drop to $2.00 or lower is high.
- MACD and short-term moving averages still indicate strong selling pressure.
Currently, XRP is in a decisive zone, with $2.10 as a key support level and $2.20 as a resistance level that needs to be broken to confirm further upside.