XRP Market Analysis: XRP Struggles Near $2 as Bears Dominate – Is a Reversal Imminent?

Currently, XRP is trading between $2.11 and $2.13 over the past hour, with a market cap of $123 billion and a 24-hour trading volume of $3.39 billion. Traders are facing a volatile market as XRP fluctuates between $2.06 and $2.22, driven by conflicting technical signals.
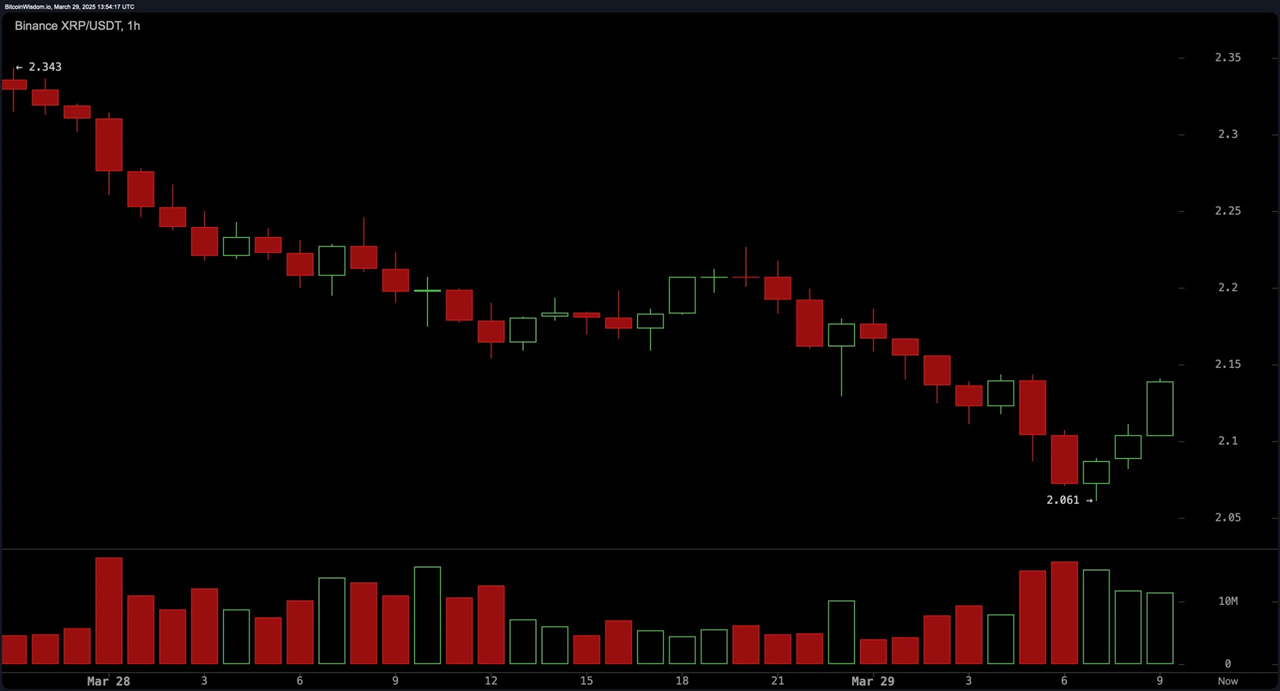
Short-Term Chart (1H): Bears Remain in Control
On the one-hour chart, XRP is showing signs of a slight recovery after bouncing from the $2.06 support level. The appearance of small green candles accompanied by an increase in volume points to buying pressure during the day. However, the key resistance in the $2.15 to $2.20 zone has limited the upside, making this an area for the bulls to overcome. Traders can consider entering on a pullback near the support level, with the aim of taking profits within this narrow range. A stop loss below $2.050 could help mitigate the risk of an unsuccessful attempt to rally.
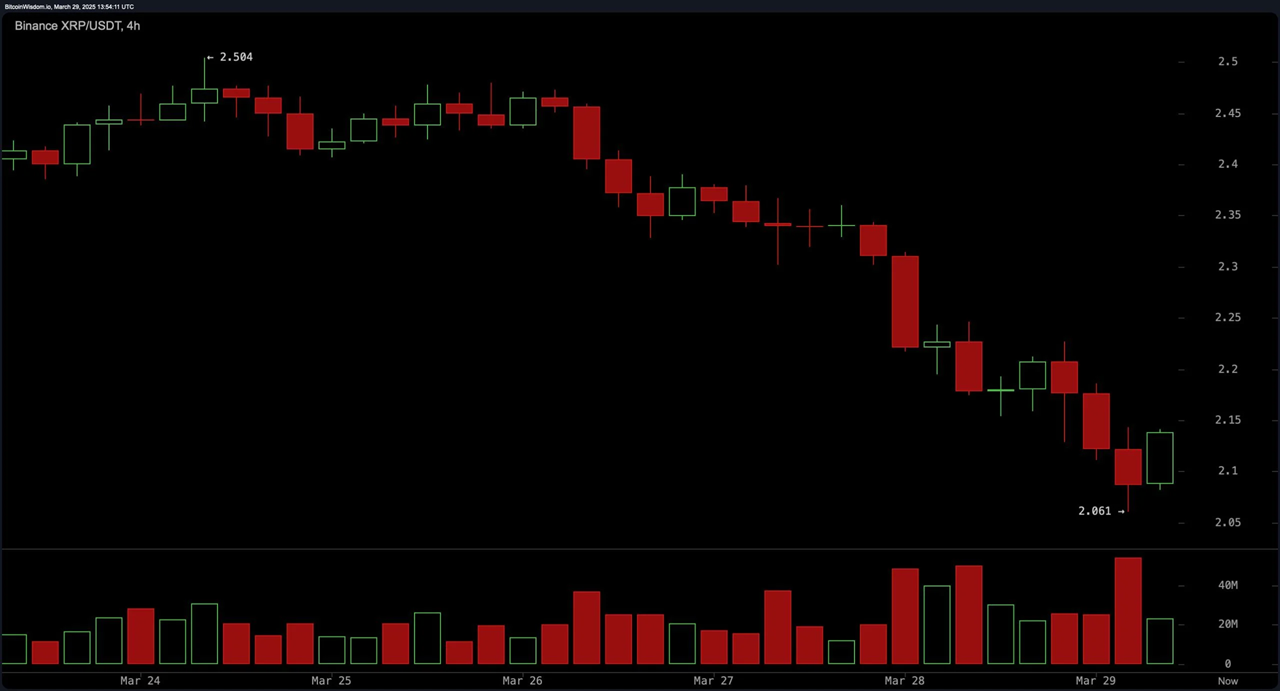
Medium-Term Chart (4H): Clear Downtrend
The four-hour chart shows a clear downtrend, marked by a series of red candles and some extended declines. Volume analysis suggests strong sell-offs, although recent sessions have seen a slight recovery. Support is strong at $2.060 while resistance in the $2.30 to $2.40 zone is proving formidable. If the price is rejected near $2.2 to $2.3, this could be an entry opportunity for short positions. Conversely, a bullish engulfing candle above $2.1 with strong momentum could open up opportunities for traders to buy. Stop losses should be adjusted below $2.05 to minimize the risk of further declines.
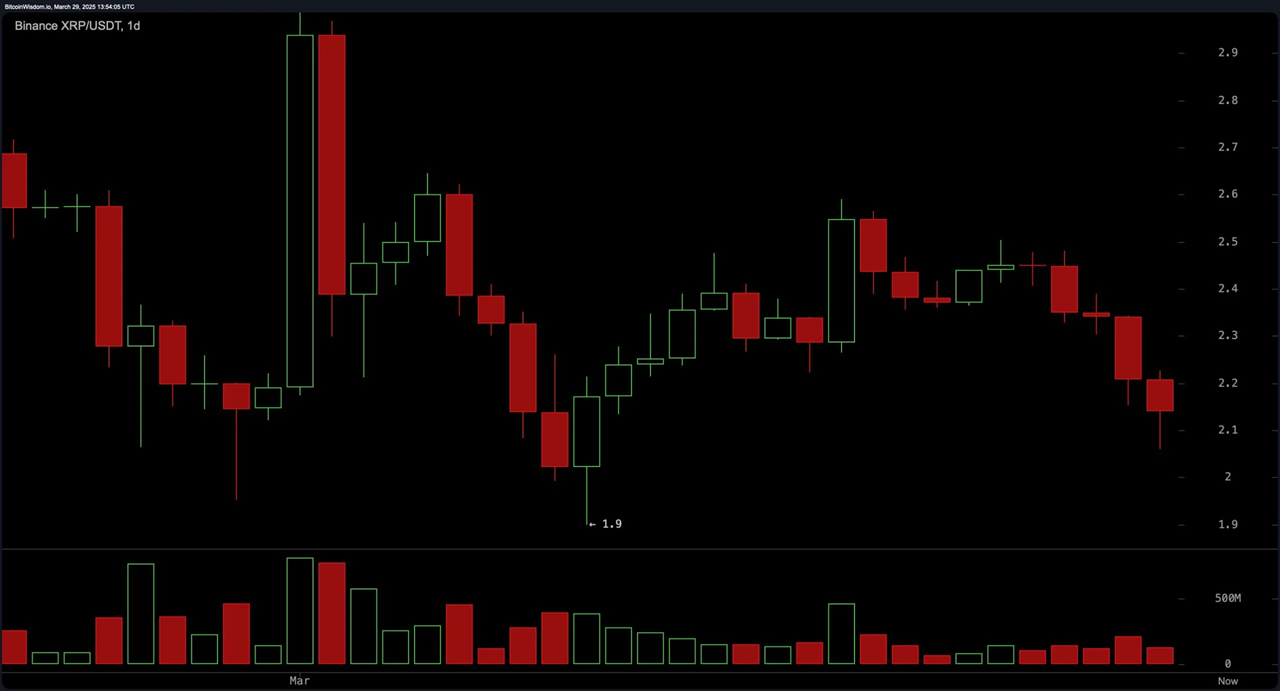
Long-Term Chart (1D): Cautious Outlook
The daily chart reinforces the bearish market structure as XRP continues to make lower highs and lower lows. The key support is located at $1.9 while resistance near $2.5 continues to test any upside attempts. Daily volume patterns favor the bears, especially on bearish candles, suggesting that selling pressure remains strong. Short positions near resistance may continue to be profitable, while long positions should only be considered if there is a strong rebound from $2.1 or $1.9 along with increasing buying volume.
Oscillators: Neutral to Bearish Sentiment
The relative strength index (RSI) is currently at 40.14, indicating neutral momentum, with no clear overbought or oversold conditions. The stochastic oscillator at 19.25 also reflects neutrality, along with the commodity channel index (CCI) at -129.79. The average directional index (ADX) is at 12.71, indicating a weak trend. Other oscillators such as the awesome oscillator (-0.022), momentum (-0.406), and the MACD (-0.036) all suggest further downside in the short term, supporting the sell stance.
Moving Averages: Bearish Continuation Signal
XRP’s moving average structure confirms the bearish trend. The 10, 20, 30, 50, and 100-period EMAs are all above the current price, reflecting strong selling pressure. Only the 200-period EMA at 1,938 and the 200-period SMA at 1,779 provide a buy signal, indicating long-term support. To break this structure, XRP needs to reclaim key EMA and SMA levels, especially the 10 and 20-period levels.
Bulls’ Verdict:
XRP could present a short-term opportunity if it holds support at $2.06 and breaks above $2.15 on strong volume. A breakout above $2.30 could open up further upside potential. However, until this happens, traders should be cautious and consider entering positions near support with strict risk management measures.
Bears' Verdict:
From a bearish perspective, XRP continues to show weakness across all major timeframes. Bears may take advantage of short opportunities when the price fails to break the resistance levels of $2.15 or $2.30. With a clear bearish bias, XRP is likely to continue falling towards the support zone of $2.00 or $1.90.