Bitcoin Price Struggles: Is $86,000 Still a Key Level for a New Breakout?

On April 18, 2025, Bitcoin (BTC) price hovered around $84,550, as the market entered a consolidation phase ahead of a potential breakout. Traders are closely watching the $86,000 resistance zone and the $82,000 support zone – two levels that could determine the next direction.
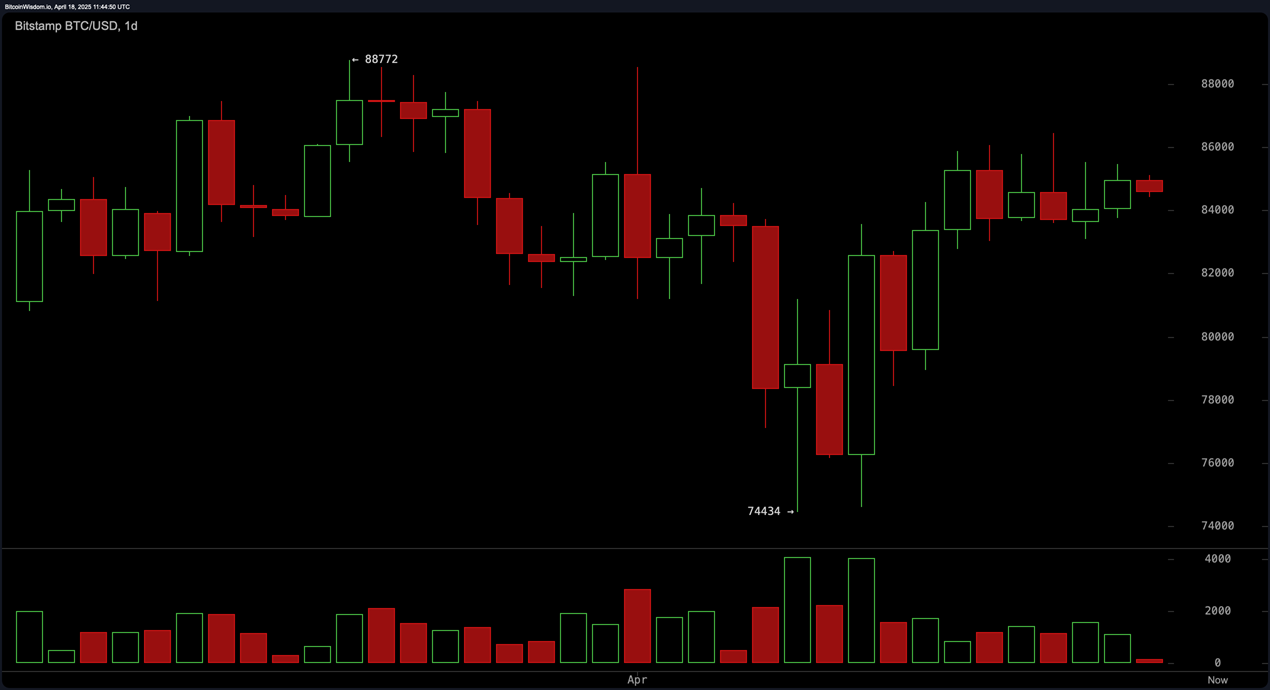
Daily Chart: Accumulating Pressure at $84,000
On the daily chart, BTC has maintained a trading range between $74,434 and $88,772 since the beginning of the month. The strong recovery from the $74,434 bottom formed a V-shaped pattern, bringing the price back into the accumulation zone around $84,500. If BTC convincingly clears $86,000, the next leg up could take the price towards the $90,000 region. However, a loss of $82,000 could lead to a retest of the support area around $78,000 and beyond.
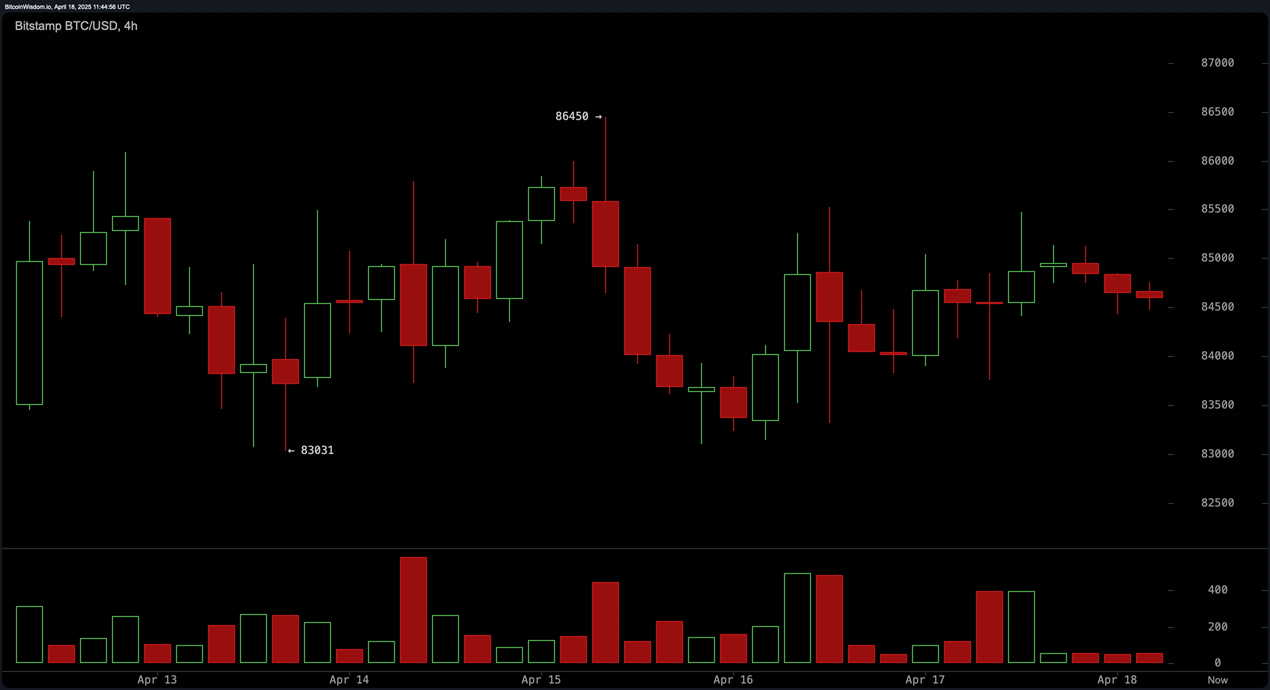
4-hour chart: Waiting for trend confirmation
On the 4-hour chart, BTC is moving within the $83,031 – $86,450 corridor. Low volatility coupled with mixed candlesticks indicate clear indecision. A breakout with increased volume above $86,450 could trigger a fresh wave of buying. Conversely, a break below $83,031 could open up space for sellers to take control.
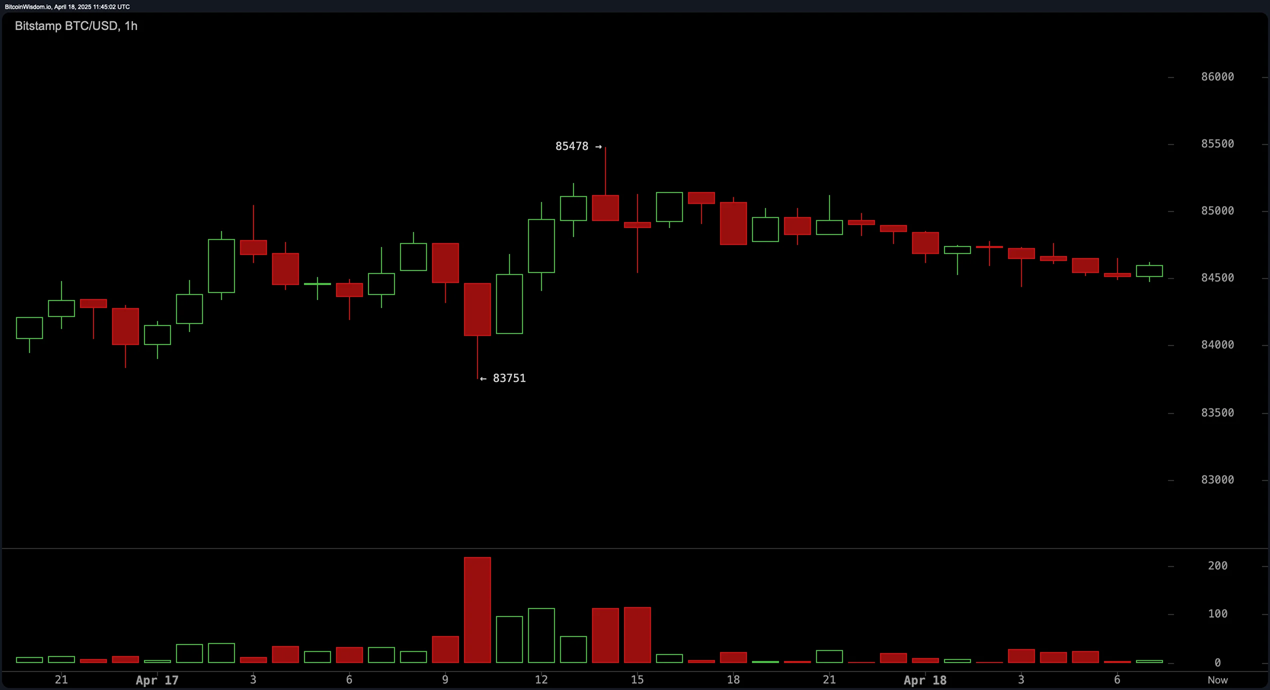
1-hour chart: Short-term bearish momentum, buy zone around $83,750
The 1-hour chart shows BTC is still following a mild descending channel from the $85,478 high, with immediate support at $83,750. The weakening short-term momentum means long positions should be considered carefully, with a range-bound strategy preferred over trend-following. If BTC holds the $83,750–84,000 zone, this could be an attractive area to accumulate before the next rally.
Technical indicators: Neutral with a slight bias to the bulls
The oscillators paint a balanced picture, with RSI at 52, CCI at 76, and Stochastic near the overbought zone at 84. The AO and MACD are both starting to flash slightly bullish signals. The MOM at 8,334 is a positive, suggesting that the recovery momentum is still there.
The short-term MAs are all bullish, with the 10-period EMA at 83,694 and the 30-period EMA at 83,871, below the current price. However, the longer-term EMAs and SMAs (50 periods and above) remain above the price, warning of a correction risk if no new buying pressure emerges.
Conclusion:
If Bitcoin breaks above $86,000 on high volume and stays above the 20–30-period EMAs, the uptrend could resume, opening up a target of $90,000 in the medium term. Conversely, a break below $83,000 would shake sentiment, increasing selling pressure in the short term.