Bitcoin Price Heads Towards $112,000 as Market Holds Support Around $107,000

On May 25, 2025, Bitcoin (BTC) was trading at $107,259, with a market capitalization of $2.13 trillion. Over the past 24 hours, BTC has fluctuated between $106,954 and $109,225, recording an impressive trading volume of $24.98 billion. The short-term volatility reflects high interest and active participation from investors.
Short-term technical analysis: Hopes for a recovery from a double bottom
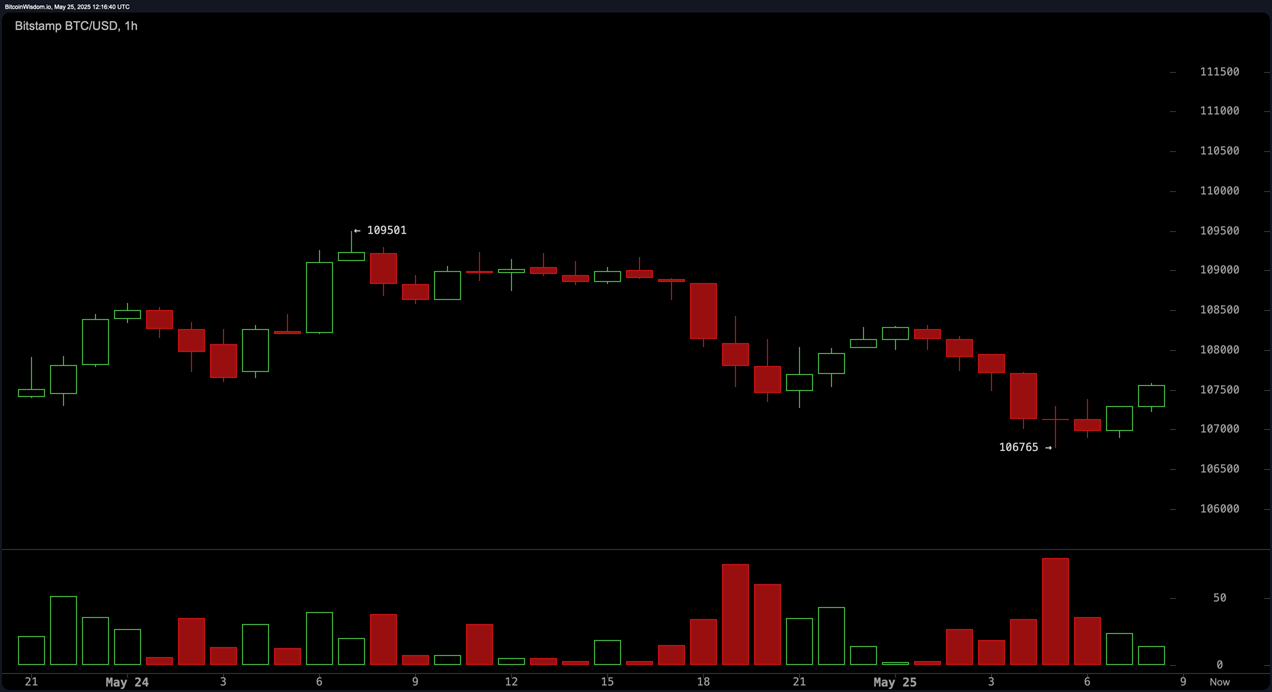
On the 1-hour chart, BTC is attempting to stabilize after a short-term downtrend, currently supported at $106,765. Technical signals point to a possible double bottom pattern, or a subtle bullish divergence between price and volume. Specifically, the volume has been decreasing during the dips but increasing slightly with green candles – a sign that buying pressure may be returning.
Day traders can look for buying opportunities around the $107,000 – $107,300 area with a stop loss below $106,700. For more cautious traders, a safer entry point could be when BTC breaks above $108,000, targeting profit taking at $108,800 – $109,500.
4-hour timeframe: The temporary downtrend is not over
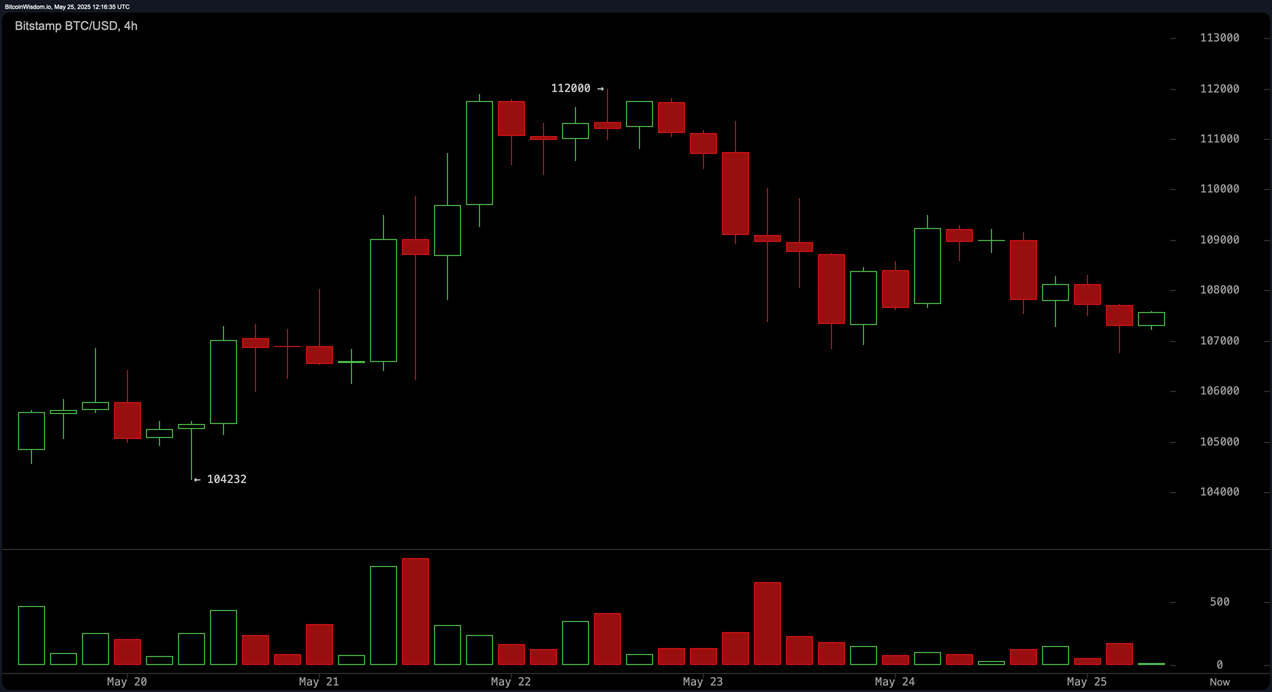
The 4-hour chart shows that BTC is forming a rounding top pattern, a common signal before entering a correction phase. Since peaking at $112,000, BTC has been making a series of lower highs and lower lows, with selling volume surging during the decline from $111,000 to $107,000.
However, if BTC recovers from the $106,500 – $107,000 zone with weak selling volume, this could be a reversal point. Conversely, a breakout above $108,500 with high volume could confirm a short-term uptrend, towards the $109,500 – $110,000 resistance zone.
Daily Timeframe: Long-Term Uptrend Remains In Place
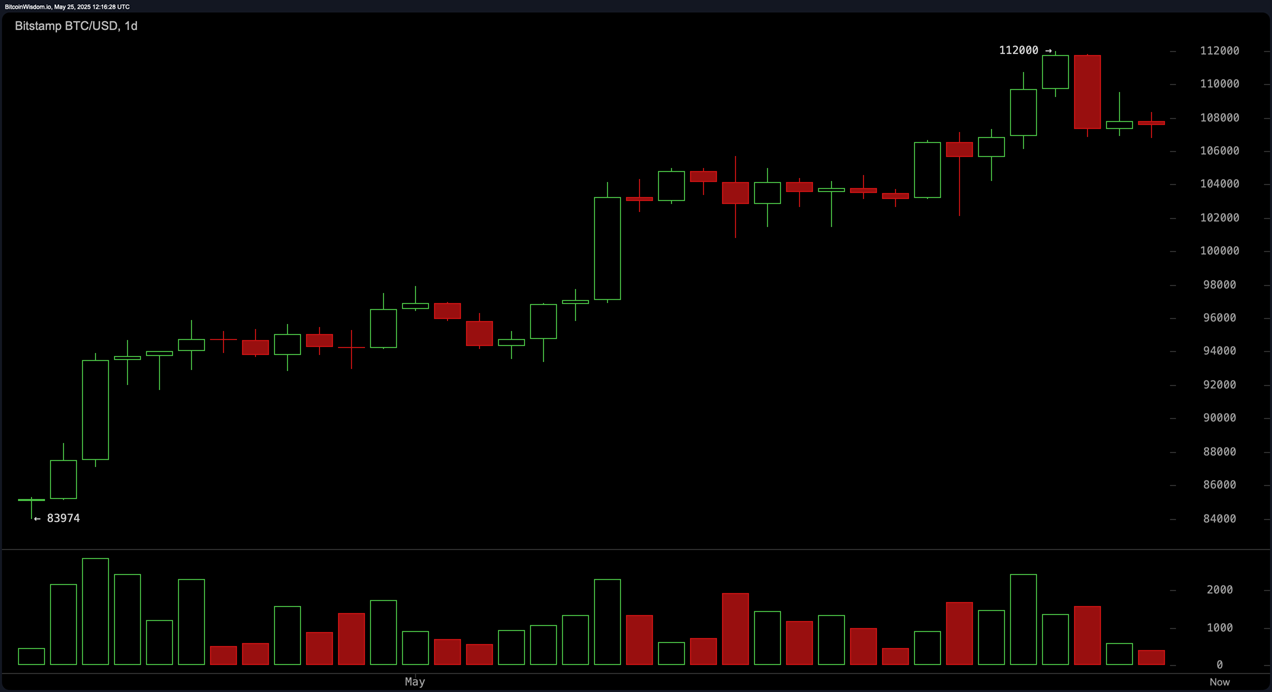
On the daily chart, BTC remains in a primary uptrend despite facing strong selling pressure at the psychological $112,000 resistance zone. The current strong support zone is in the $104,000 – $106,000 range, where important reversal signals could emerge. Volume data suggests that the recent selling pressure is mainly profit-taking, rather than structural weakness.
Medium-term traders should watch the price reaction around $106,000 for confirmation before re-opening long positions, targeting the $112,000 resistance zone.
Technical indicators: Neutral with a slight bearish bias
The RSI is currently at 63, indicating that the market is in neutral territory.
The Stochastic (60) and CCI (81) reflect fading momentum.
The ADX is at 33, indicating that the trend is not strong enough to dominate.
The Momentum indicator (3,575) and the MACD (3,700) both give a mild sell signal, suggesting that bearish pressure remains in place in the short term.
Nearest support at $107,810 and $108,133
These areas act as important technical bounce points, especially for short-term swing traders.
Moving Averages: Long-term Uptrend Support
All 10- to 200-period EMAs and SMAs are currently in the buy zone:
10-period EMA & SMA are both above $106,890, supporting short-term bullish setups.
200-period EMA at $89,658, 200-period SMA at $93,966 — confirming the long-term bullish structure is intact.
Conclusion
Bullish view:
If BTC holds $107,000 and breaks above $108,500 on strong volume, a retest of $112,000 is possible. The technical structure remains bullish, barring any surprises from the macro.
Bearish view:
The selling pressure is not yet completely over. If BTC breaks through $106,700, a deeper correction to the $104,000 – $101,294 zone could occur.
Recommendation:
The market is currently at a key technical pivot point. Traders should prioritize trend trading with volume and price action confirmation. At the same time, a tight risk management strategy should be maintained amid volatile volatility.