Bitcoin Oscillates Near Peak: Investors Stuck Between Bullish Expectations and Short-Term Cautiousness

May 14, 2025 – Bitcoin continues to trade above $104,000, reflecting relative stability amid market anticipation for a clear breakout. At the time of writing, BTC hovers around $104,071 with a total market cap of over $2.067 trillion and 24-hour trading volume of around $30.25 billion.
Over the past 24 hours, the price range of $103,108 to $104,836 suggests a tug-of-war between buying and selling pressure as the market enters a short-term accumulation phase.
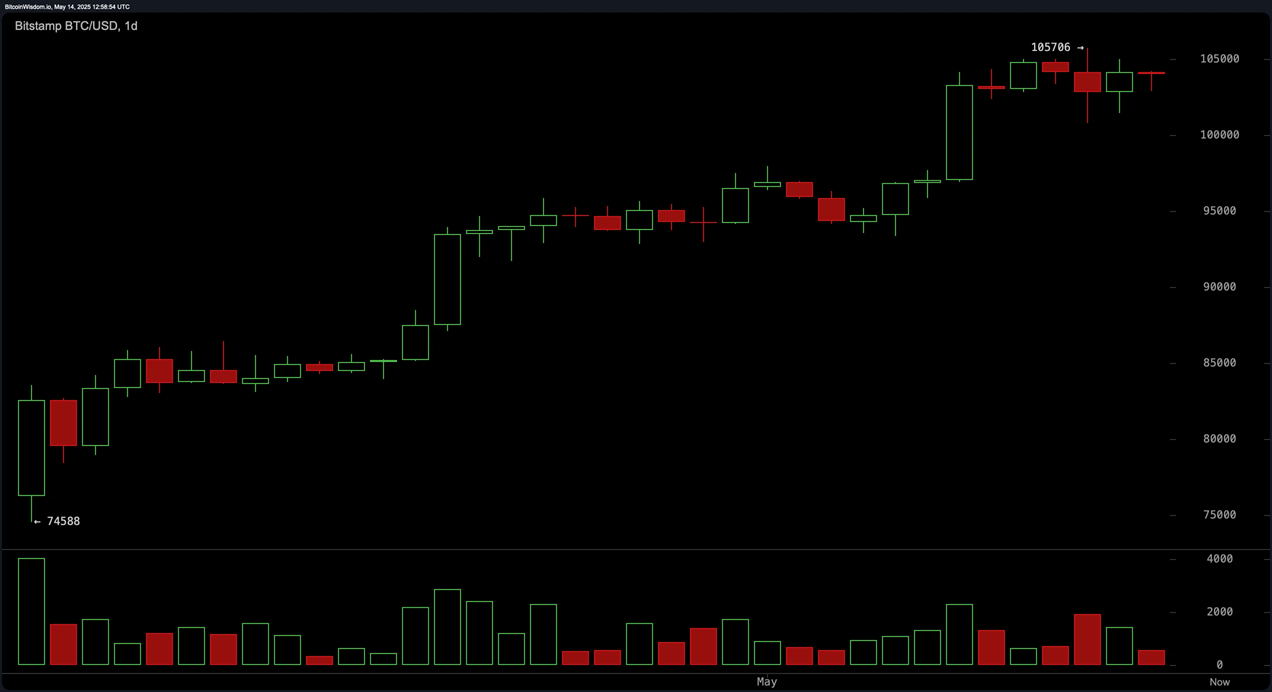
Daily Chart: Bullish Momentum Remains
On the daily timeframe, bitcoin remains bullish after climbing from the $74,588 area to the recent high of $105,706. However, the price is currently consolidating below this key resistance level while trading volume is gradually decreasing, reflecting investor hesitation.
A clear breakout above $105,706, accompanied by strong volume, could confirm the continuation of the uptrend. Conversely, if the price breaks through the support area around $95,000, a deeper correction could be triggered.
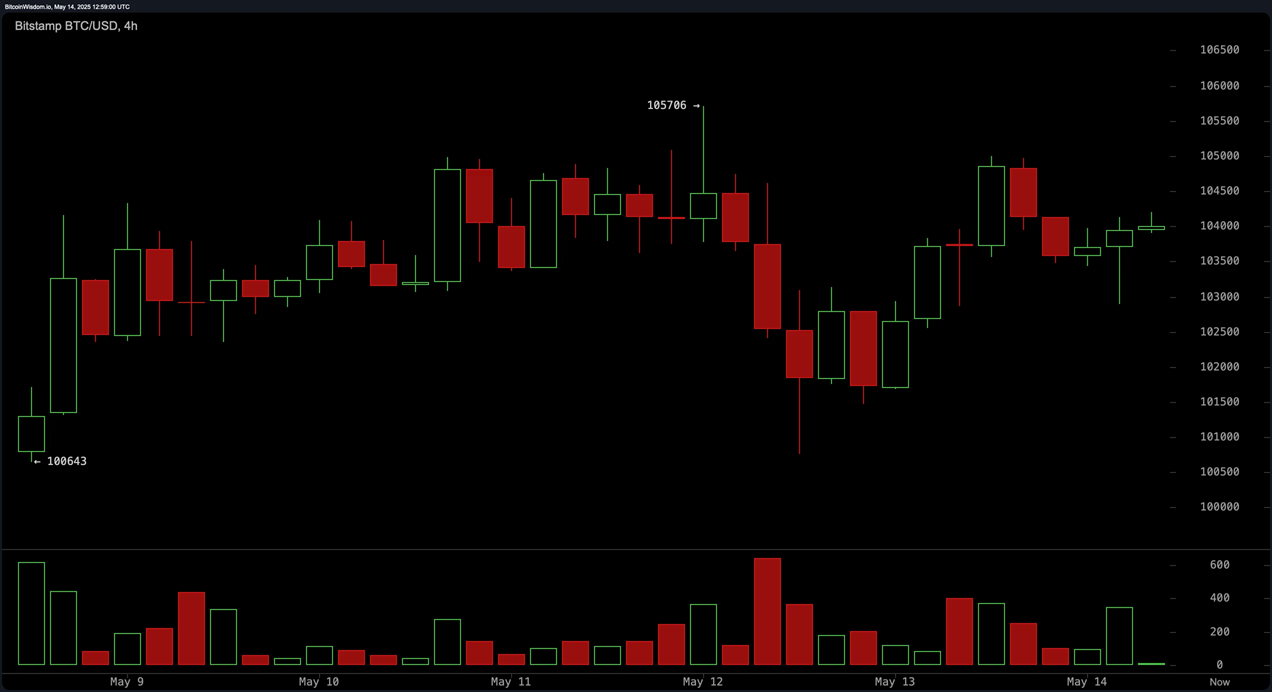
4-hour chart: Short-term selling pressure remains present
On the 4-hour chart, bitcoin has been rejected twice at $105,706, forming a double top pattern – a warning sign for a possible correction. Although the price recovered slightly to near $104,000, the buying pressure was not strong enough to confirm the bullish momentum. If BTC breaks below $101,000, the market sentiment could turn more negative, opening the possibility of a test of the psychological $100,000 mark.
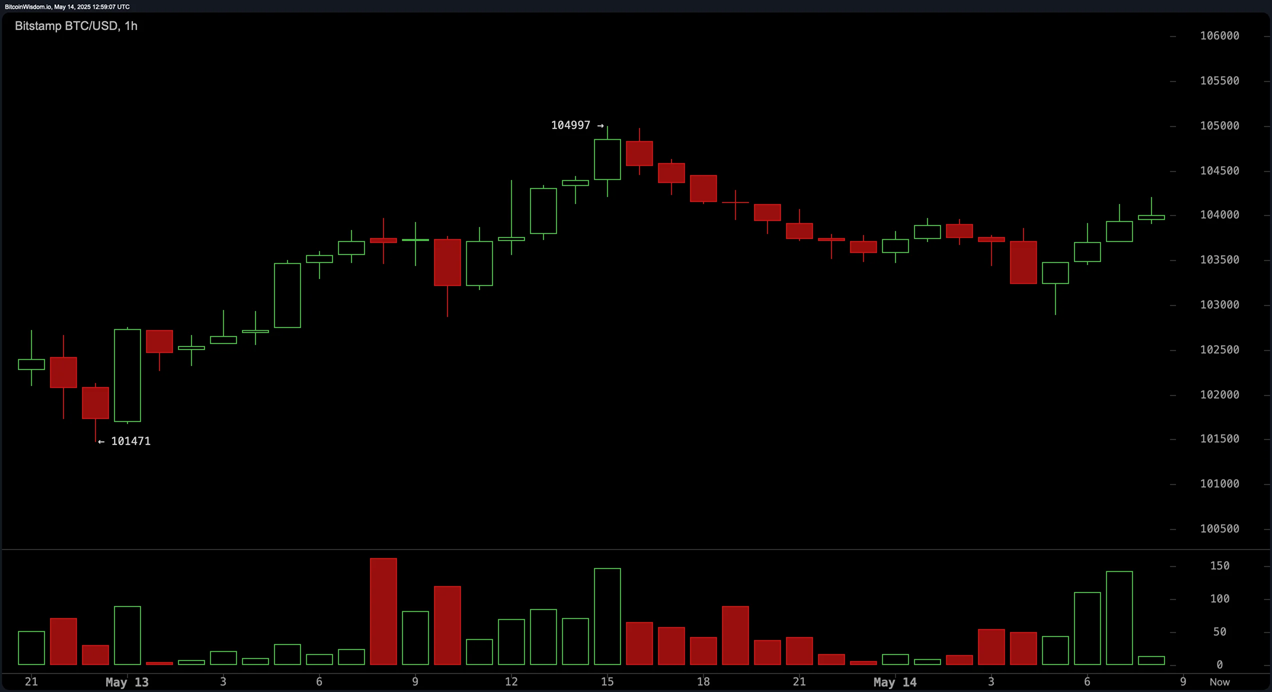
1-hour chart: Sideways trading and mild bearish bias
In the short term, the 1-hour chart shows a correction from $104,997 to near $103,000, with the recovery attempt still unconvincing. Selling pressure remains dominant as bearish candles have higher volume than bullish candles. BTC’s failure to hold above $104,000 could continue to exert downward pressure, while a breakout above this level could attract scalpers.
Technical indicators: Mixed signals
RSI is at 71 and CCI is at 102, both indicating that the market is overbought and has potential for a correction.
Meanwhile, MACD and momentum indicators still maintain a slight buy signal.
Stochastic at 84 and ADX at 36 reflect neutrality and lack of a clear trend in the short term.
Moving averages: Long-term bullish signal remains strong
EMAs and SMAs on multiple timeframes still maintain a bullish structure. Specifically:
EMA (10) at $101,717 and SMA (10) at $101,480.
EMA (200) and SMA (200) at $87,679 and $91,970, respectively – important levels that show strong support in the long-term trend.
Bull Case Conclusion:
If bitcoin successfully breaks the $105,706 level with outstanding volume, a new rally could be triggered, taking the price towards a new all-time high. The technical structure on the larger timeframes is still in favor of the uptrend.
Bear Case Conclusion:
If bitcoin continues to be rejected at the $104,500–$105,700 resistance level and breaks the $101,000 support zone, the risk of a deeper correction to the $95,000 or even $90,000 zone could arise, especially as trading volume continues to decline.
The current situation requires patience and careful observation from investors. As the short-term trend is unclear, identifying important support-resistance levels and accompanying trading volume will be the key to orienting trading strategies in the coming days.