Bitcoin Heads Towards $108,000 as Bullish Momentum Builds on Short-Term Timeframes

Bitcoin is trading steadily around $106,000, showing signs of a slight recovery after a recent consolidation and technical correction. While the market still lacks a clear trend on the daily timeframe, the short-term charts are showing that bullish momentum is building, attracting the attention of bulls with the nearest target at $108,000.
Narrow Range Price Movement: Accumulation or Indecision Signal?
Over the past 24 hours, Bitcoin has been trading in a narrow range between $104,004 and $106,450, indicating continued technical indecision. With a market cap of $2.10 trillion and an intraday trading volume of around $21.88 billion, the current price stability suggests more of an accumulation phase than a pullback.
While the primary trend remains unclear, several technical patterns are forming on lower time frames that are keeping traders interested in a short-term bullish scenario.
1-Hour Chart: Rebound Momentum and Clear Breakout
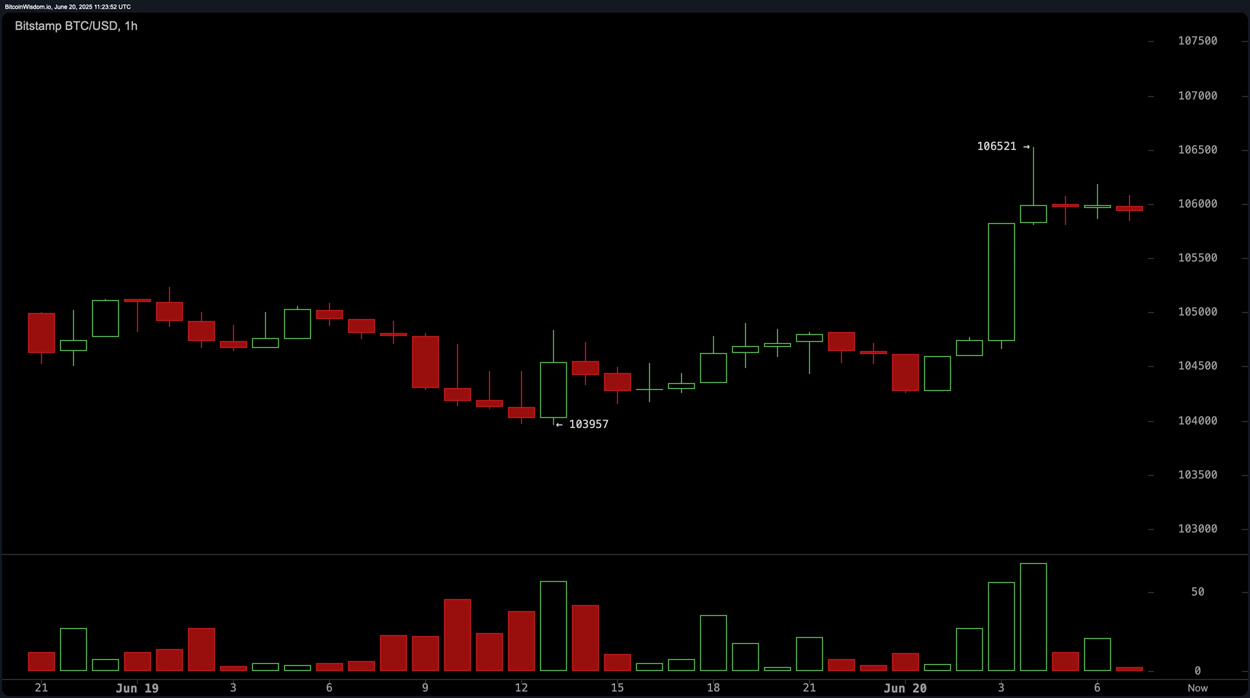
On the 1-hour chart, Bitcoin has completed a double bottom pattern around the $103,957 support area, a pattern that typically signals a short-term bullish reversal. After breaking above $106,000 on a surge in buying volume, the price is now approaching the short-term resistance at $106,521.
If the price can decisively surpass this level, investors can expect BTC to move towards the next target area in the $108,000, $109,000 region. Conversely, if there is a correction to the $105,500 region, this could be the next opportunity for long positions with the expectation of a continued recovery.
4-hour chart: Bullish structure forming
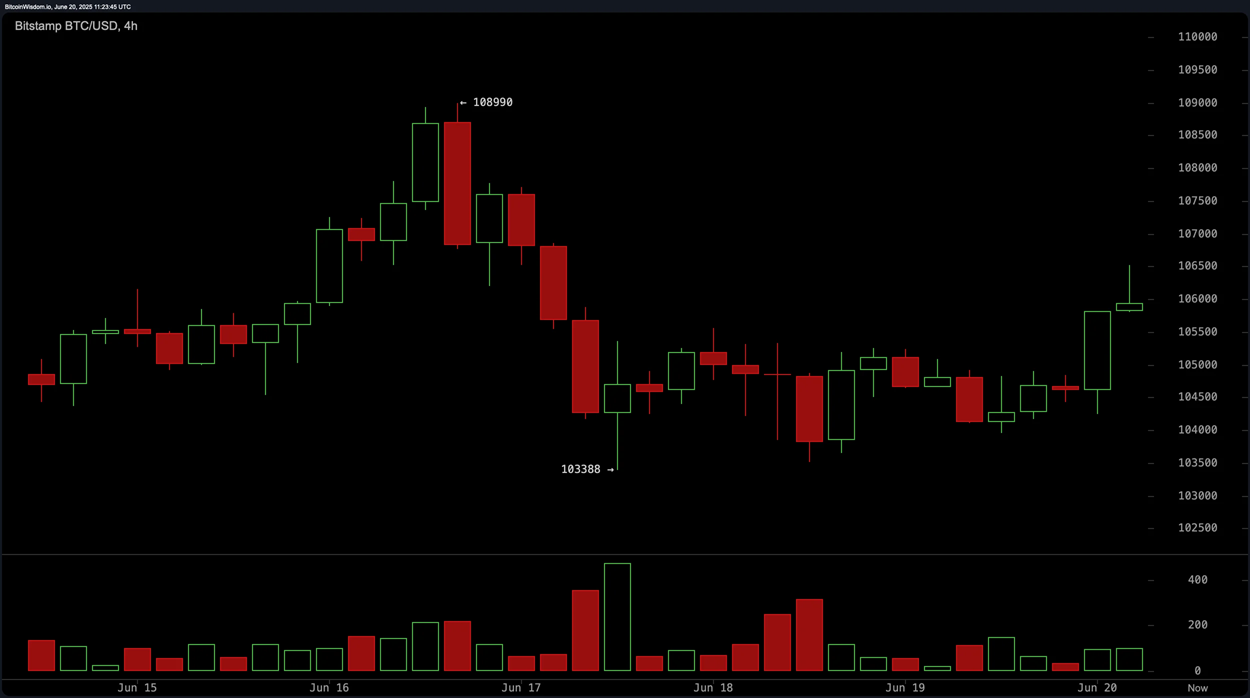
The 4-hour chart shows a gradual recovery taking shape since BTC bottomed at $103,388. The positive volume profile, coupled with the rounding bottom pattern, reinforces the possibility that the market is in a short-term reversal phase.
The $105,500, $106,000 region shows clear buying pressure, with consecutive bullish candles signaling accumulation. A break above $106,500 would serve as confirmation for the uptrend, with a target of $108,000 if volume continues to support.
Daily Chart: Waiting for Confirmation Before a Sustainable Reversal
While lower time frames suggest bullish potential, the daily chart still reflects a neutral to bearish bias. The recent rejection at $112,000 resulted in a correction to a low of $100,426. Currently, BTC is trading within a bearish flag pattern, a technical sign that could be risky if there is no clear breakout.
To establish a long-term uptrend, Bitcoin needs to break above $107,500 with a solid daily candle close, and further test the $110,000 region. Failure to do so could see a fall back to the key support zone of $103,000, $100,426, especially as volume and momentum weaken.
Technical indicators: Divergent signals
Overall, oscillators such as RSI, CCI, Stochastic and ADX are all in neutral territory, failing to confirm a clear trend. Meanwhile, MACD continues to hover below its signal line, suggesting that bearish momentum remains on the larger timeframe.
On the contrary, short-term to long-term moving averages are mostly tilted to the positive side, with the exception of the 30-day MA, which is showing a negative signal. This suggests that the short-term trend may be forming an upward trend, but is not yet fully supported by the larger timeframe.
Bullish Scenario: If $106,521 Is Broken
If Bitcoin breaks above $106,521 with confirmed volume, traders can expect a further rally towards $108,000, where some strong resistance levels have been present since the beginning of the month. A daily close above $107,500 would be pivotal to confirm a new uptrend, potentially opening up room for a deeper recovery towards $110,000, $112,000.
Bearish scenario: Failure below $106,500
If Bitcoin continues to face strong resistance at $106,500 and fails to close the daily candle above $107,500, profit-taking pressure could drag the price back to the $105,000 support zone, or even lower to $103,000, $100,426 if negative sentiment spreads. Declining volume and negative signals from MACD will increase the probability of this scenario.
Conclusion: Trade cautiously, watch for confirmation
Bitcoin is currently at a critical stage where recovery momentum is forming but not strong enough to establish a sustainable uptrend. Traders should maintain a flexible strategy, favoring short-term setups on lower time frames while waiting for clear confirmation on the daily chart.
A breakout above $106,500, and especially $107,500, would signal that the market could be moving into a real recovery phase. Conversely, failure to sustain above current support levels would send Bitcoin back into deeper correction territory. Risk control and tight position management remain top priorities amid the volatile market.