Bitcoin Facing Decisive Level: Technical Signals Favor Bulls, But Correction Pressure Still Lurks
-min.png)
Bitcoin continues to lead the market as it hovers around $92,320, with a market cap of $1.82 trillion and a 24-hour trading volume of $36.78 billion. The intraday price action has formed a range between $91,600 and $94,200, reflecting a tug-of-war between buyers and sellers amid a volatile market.
1-Hour Timeframe: Short-Term Signals Still Hesitant
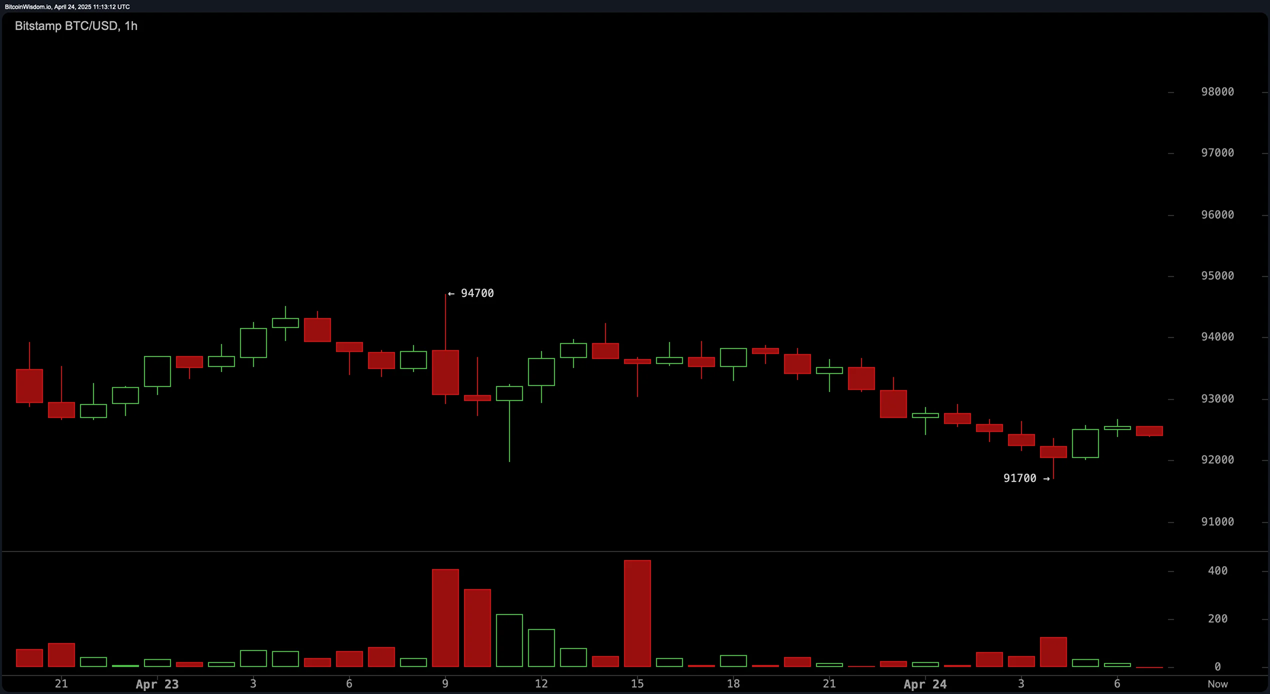
On the 1-hour chart, Bitcoin is forming a short-term bearish structure with a series of lower highs and new lows being created. The rejection of the $94,200 zone early in the session has caused the price to turn around and retest the $91,600 support zone. Although there has been a slight buying reaction from this area, the trading volume is still tilted towards the red, indicating that the selling momentum has not been completely eliminated. A potential entry point could be formed if Bitcoin establishes a higher low around the $91,700 area with signs of weakening selling pressure, opening the door for a recovery to the $93,200 area in the short term.
4-hour timeframe: Accumulation phase or the beginning of a deep correction?
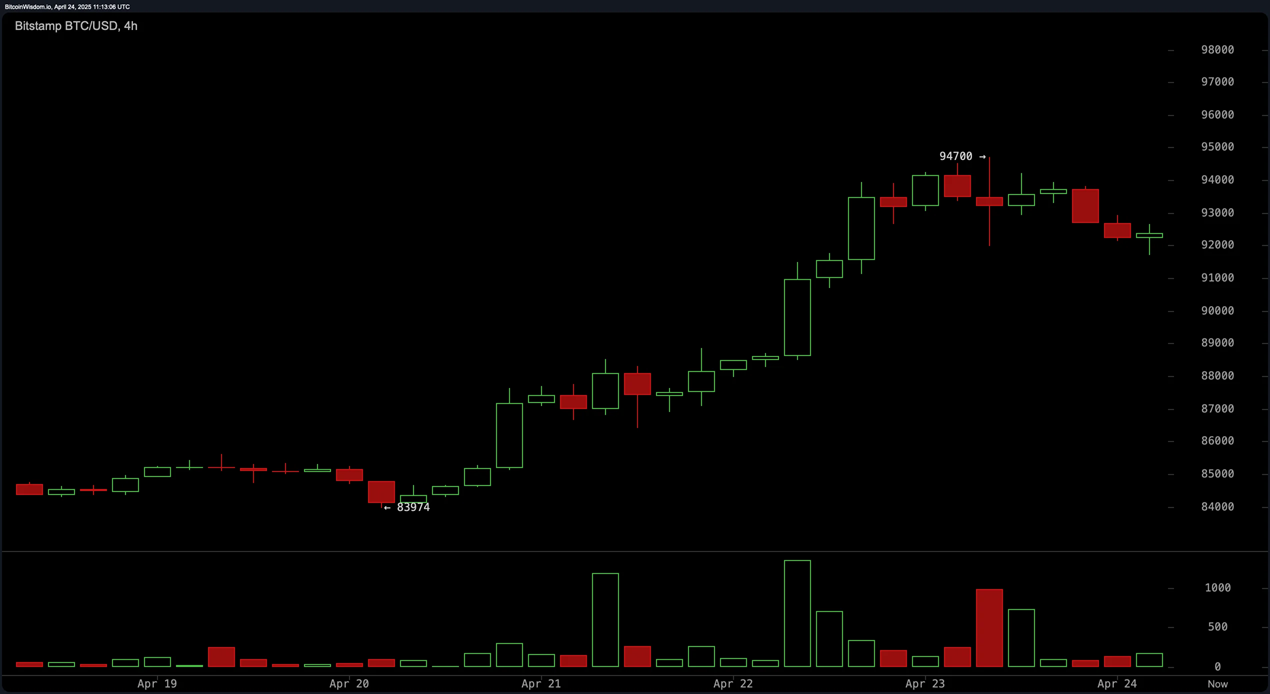
Looking at the 4-hour timeframe, a rounded top pattern has started to appear after the recent rally. The weakening candles around the top area, along with decreasing volume, reflect a short-term distribution state. However, the $92,000 – $92,500 price zone is currently acting as a key support zone. If the price continues to fluctuate in this area with a narrow range and no negative breakout appears, the possibility of forming an accumulation pattern will be reinforced. A bounce back to the $94,000 area could then occur, especially if buying volume returns.
Daily timeframe: Uptrend remains solid but signs of overheating to watch
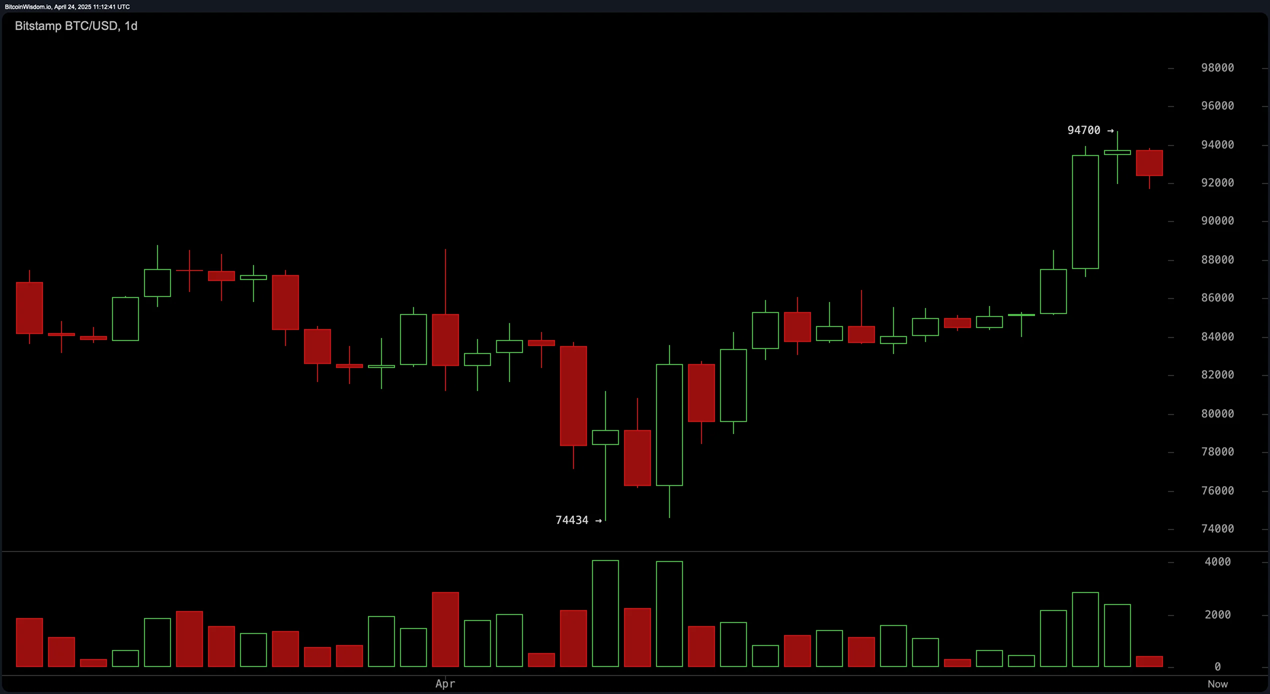
The daily chart continues to reflect an impressive recovery, from the low of $74,434 to the high of $94,200. The series of strong green candles with high liquidity establishes a clear uptrend. However, a slight pullback after hitting the strong resistance zone of $94,200 is understandable. Strategic support zones are in the $83,000 – $85,000 range and a potential area for re-entry is identified at $88,000 – $90,000 if selling pressure weakens. Reasonable profit-taking targets remain around the $94,000 – $96,000 range, unless there is a breakout above the resistance with convincing volume.
Technical indicators: Divergence between momentum and oscillators
Analysis of the oscillators shows mixed signals. RSI at 64 shows that the market has not yet entered the overbought zone, but indicators such as Stochastic (91) and CCI (185) warn of overheating, suggesting a possible short-term correction. On the contrary, MACD continues to maintain a positive trend at 1.931, reinforcing the bullish momentum. Neutral indicators such as ADX and Awesome Oscillator show that the market is still looking for a clear direction in the short term.
Moving Averages and Fibonacci: Long-term Strategy Guide and Entry Points
The moving averages (EMA and SMA) from short to long term are giving clear bullish signals. The 10-period EMA at $88,460 and the 10-period SMA at $87,300 act as short-term support, while the 200-period EMA and SMA at $85,200 and $88,600, respectively, continue to maintain the long-term uptrend. Fibonacci analysis also supports the entry strategy: the 0.5 level at $84,500 and the 0.618 level at $82,100 act as potential bounce zones in case of a deep correction. On the 4-hour chart, the $89,000-$90,500 zone is identified as a strategic support cluster; while on the 1-hour chart, staying above $92,800 – the 0.618 level – will be crucial to maintain the short-term bullish momentum.
Bullish Conclusion:
Bitcoin is still holding a strong bullish structure with confirmation from multiple timeframes, especially the series of moving averages maintaining an upward trend and the market momentum has not been broken. If the price continues to stabilize above the $92,800 area and there is a return of buying volume, the target of $96,000 is completely feasible.
Bearish Conclusion:
Although the overall trend is still bullish, the overbought oscillators and the short-term distribution pattern could create corrective pressure back to the $90,000 area, or even lower if the $91,700 support fails to hold.
Summary:
Bitcoin is at a critical juncture – where both the long-term uptrend and short-term correction signs coexist. Flexibility is key: tilt to the upside but do not rule out the possibility of a sudden reversal. The $92,800 area will act as a gauge for the next direction in the short term.