Bitcoin Faces Short-Term Bearish Pressure: Key Support Levels Are Being Tested

Over the past 24 hours, Bitcoin has been trading between $93,806 and $95,741, with the current trading level near $94,200. Its market cap stands at $1.86 trillion, while its daily trading volume hovers around $19.74 billion – indicating that market activity remains active but lacks a clear breakout.
Increasing Selling Pressure on the 1-Hour Chart
On the 1-hour timeframe, Bitcoin is facing a clear bearish structure after failing to hold the $96,620 high. A series of lower highs and lower lows have been formed, accompanied by a spike in red selling volume around $93,550 – implying that sellers are in control and that reactive buying pressure remains weak. The current scenario resembles a bear flag pattern, suggesting a potential further correction if the $93,550 support is broken. Meanwhile, the $95,000 area now acts as a short-term resistance that needs to be overcome for a trend reversal.

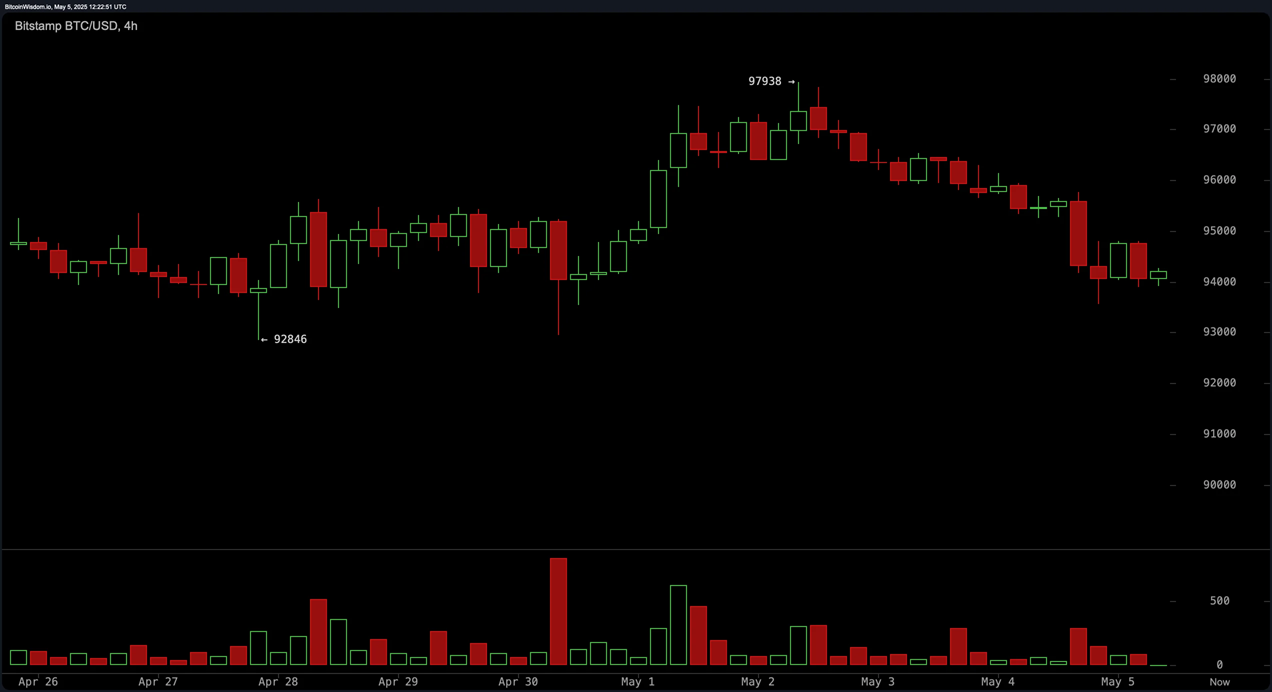
4-hour timeframe: A clear downtrend is forming
The 4H chart continues to reinforce the bearish outlook, as BTC continues to set lower highs and lower lows. The key short-term support level is located at $92,846 – a break would trigger widespread selling pressure, potentially leading to a drop to $90,000. Meanwhile, the $96,500–$97,000 resistance area continues to be a solid wall that the bulls have failed to penetrate in previous attempts. The increase in selling volume over the past two days suggests that institutions may be adjusting their positions or retail investors may be taking profits due to concerns about a weakening market.
Daily Timeframe: Weakening Bullish Momentum
On the daily chart, Bitcoin has failed to hold above $97,000 and is now entering a technical correction phase. The sharp rejection from the $97,938 high and consecutive bearish candles indicate buyer fatigue. Volume analysis also confirms this, with down days accompanied by high volume while up sessions lack money flow strength. The support zone between $93,000 and $94,000 will play a vital role in determining the next direction.

Technical indicators show clear divergence
Momentum indicators are still not giving clear signals. RSI at 60, Stochastic at 74 and CCI at 42 are all in neutral territory, reflecting the market's indecision. The ADX indicator at 30 shows that the market is not in a strong trend yet, while the Awesome Oscillator indicator has turned negative, indicating that the selling pressure is gaining the upper hand. Only the MACD remains positive, indicating that the buying pressure has not completely withdrawn.
Moving averages suggest the long-term trend remains positive
Signals from the moving averages (MAs) reflect a mixed picture: short-term averages such as the 10 EMA and 10 SMA are bearish, but long-term ones such as the 200 EMA ($86,298) and 200 SMA ($90,411) are still bullish – indicating that the bullish outlook remains intact in the long-term, despite the short-term correction.
Bullish Conclusion:
If Bitcoin holds the $93,000–$94,000 support zone and quickly recovers above $95,000 on high volume, this correction could be over. In that scenario, BTC could retest the $97,000 resistance and head towards $98,000 or higher if bullish momentum resumes.
Bearish Conclusion:
Conversely, if the $92,846 support breaks with strong selling pressure, the decline could accelerate towards the $91,000–$90,000 zone. With technical indicators tilting to the downside and market sentiment shifting, bears currently hold the short-term advantage.